Training
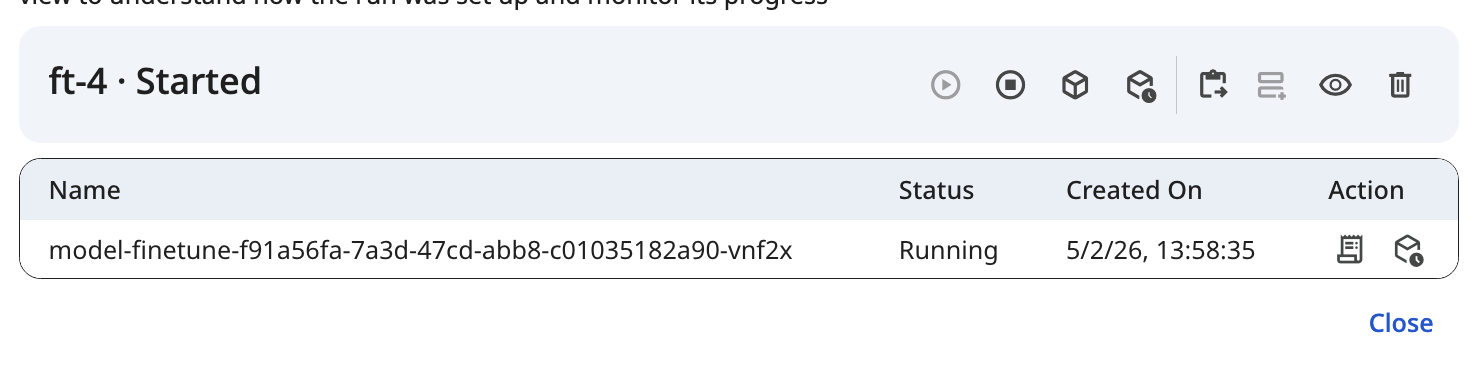
Training Runtime provides full lifecycle control over training run. It covers the lifecycle of a training run including start, stop, monitor, and deletion while maintaining visibility into runtime behavior through logs and events. The following status indicates the current state of the runtime instance. This is different from the trial status. The runtime status can be one of the following:
- Started: Runtime instance is in progress.
- Aborted: Runtime instance was stopped manually.
- Failed: Runtime instance is in the process of being terminated.
- Completed: Runtime instance has completed successfully.
 Snapshot of Protean AI Platform
Start
To initiate a training run, the complete configuration must be provided. The system will validate the configuration and allocate the necessary resources before starting the training run.
Stop
Training can be halted manually. When halted, the system abruptly stops the training process and the current state of the training run is not preserved. However, the system captures the state at a user-defined frequency. See Snapshot Frequency The training run can be resumed at a later time.
We are working on a more robust solution for graceful shutdown.
Logs and Events
Logs and events provide operational visibility into training runtimes. They help monitor execution, diagnose failures, and understand how a training behaves over time at both instance and deployment scope.
Logs
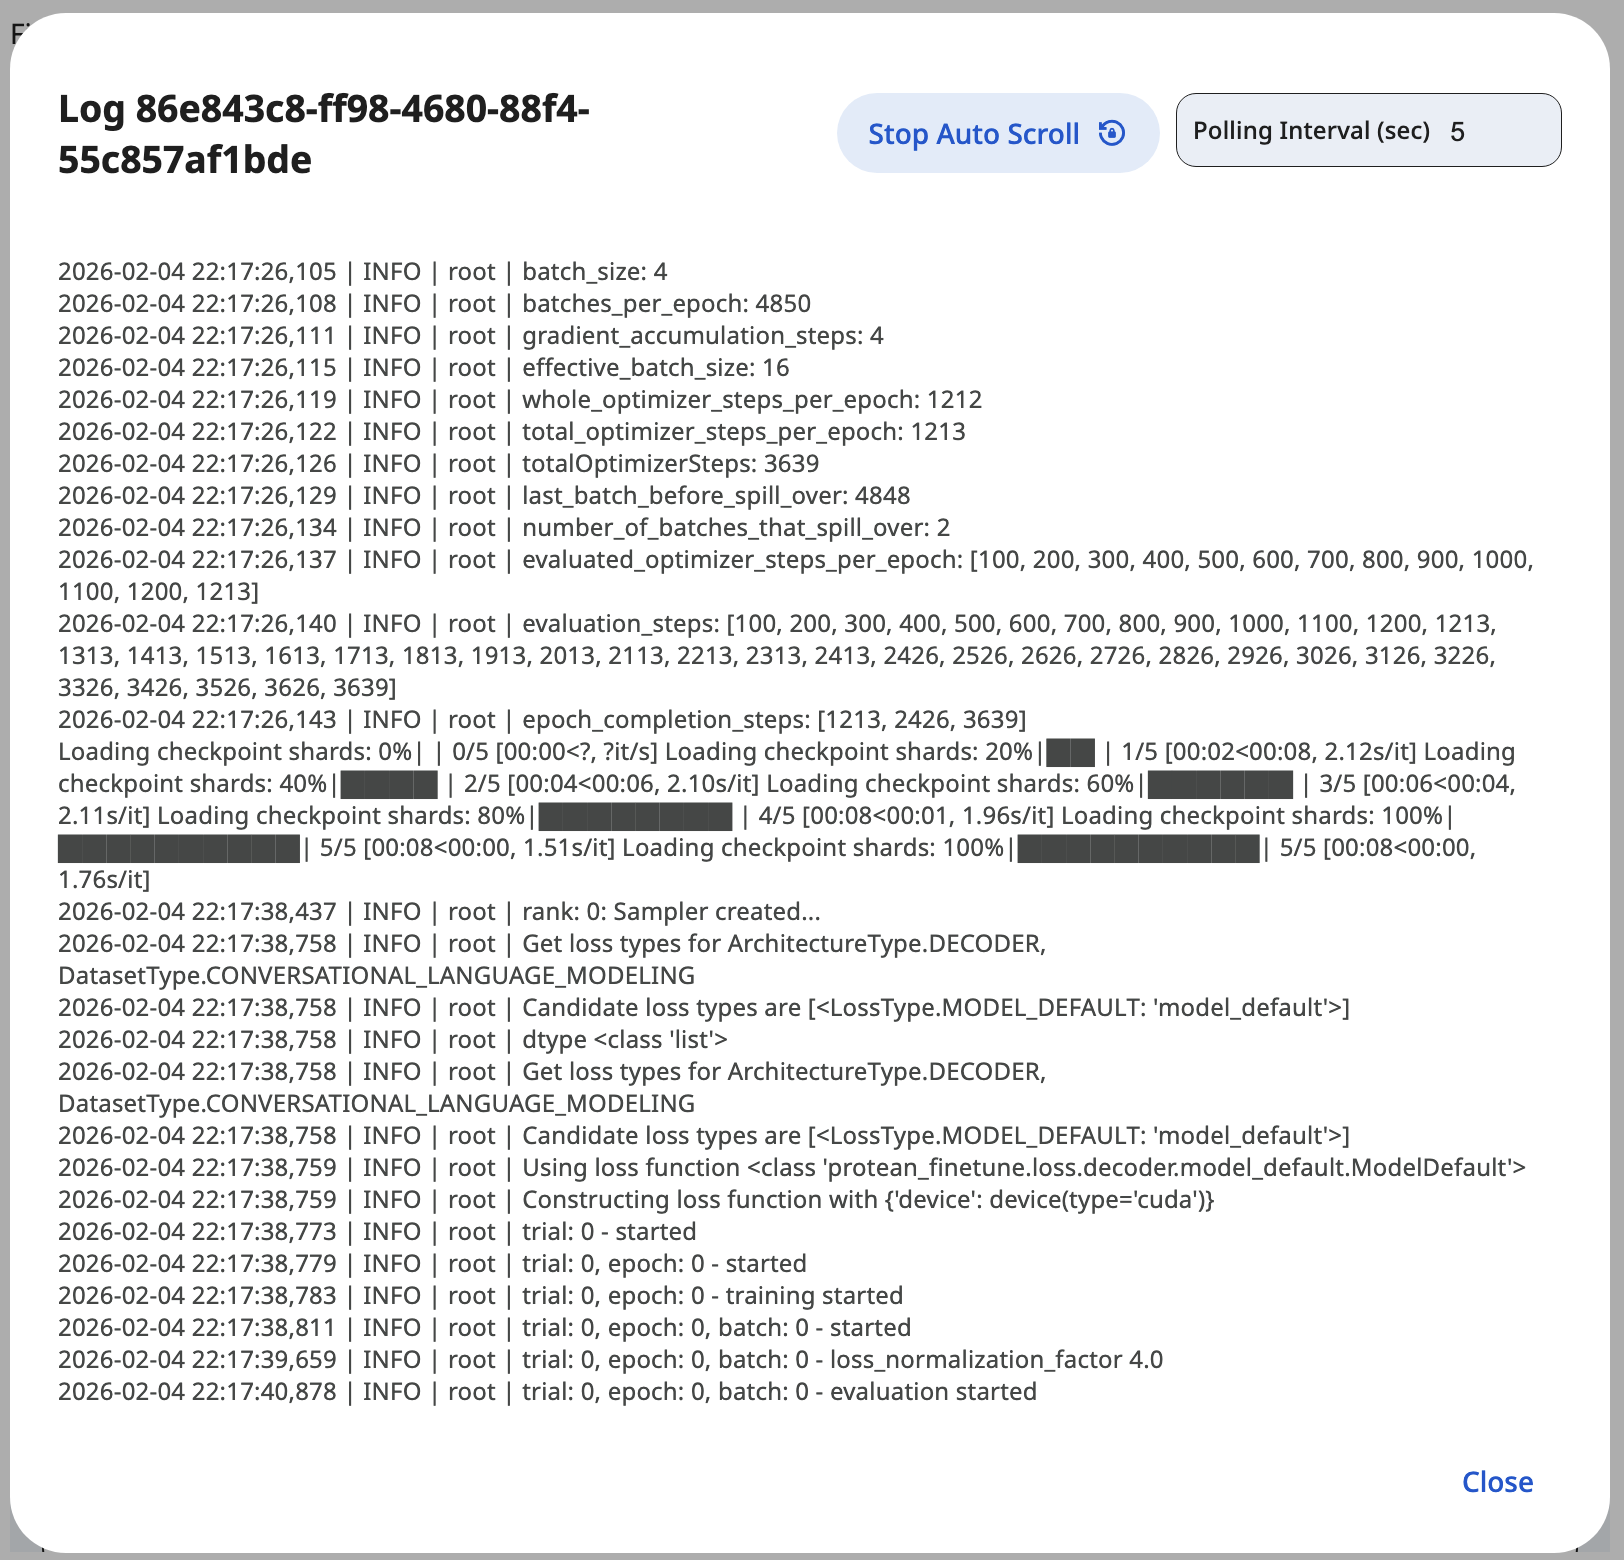
Model Runtime provides detailed observability to help diagnose issues and understand runtime behavior. Logs can be accessed at instance levels, individual runtime instances. Logs include fine-tuning progress, errors, and warnings.
 Snapshot of Protean AI Platform
Events
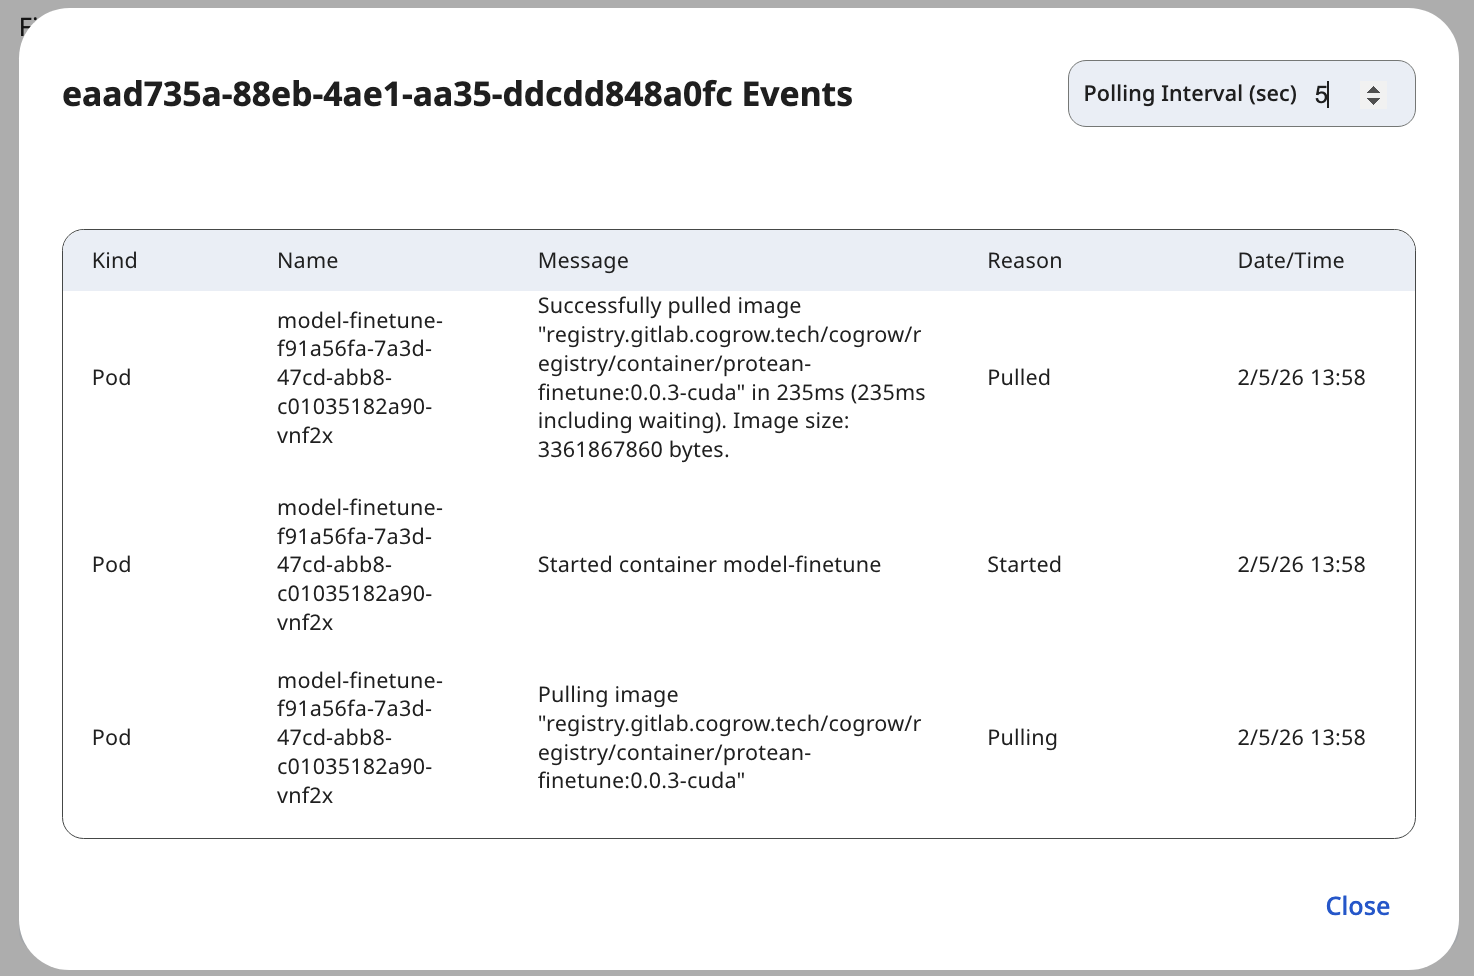
Events provide a structured view of significant runtime actions and state transitions. They are captured as discrete records each time the runtime changes behavior, so you can trace what happened and when without reading through raw logs. This matters because it lets you correlate a failure or stall with the action that triggered it. Events are organized into two categories:
- Instance-level events show lifecycle and execution events for a specific instance.
- Deployment-level events summarize changes affecting the entire runtime.
Events include:
- Scheduling decisions
- Health and readiness state changes
 Snapshot of Protean AI Platform
Progress
The progress of training is displayed in two progress bars and a graph. The progress bars and graph are updated in real-time as training progresses. The progress bar visualizes the extent the training run has progressed, while the graph tracks the training metrics.
 Snapshot of Protean AI Platform
Step Monitor
In this visualization, the progress is visualized as a continuous timeline of steps.
This includes an indication of [Current Step] / [Total Steps]. It also includes specific markers for the following structural boundaries:
- evaluation steps: Points where the training pauses to run validation are highlighted with a vertical marker
|. - epoch boundaries: Points where the epoch ends, are highlighted with a higher vertical marker
|.
Batch Monitor
In this visualization, the progress bar is visualized as a continuous timeline of batches processed in the current epoch (e.g., 450/1000).
There is also an indication of the current epoch number (e.g., E0 implying epoch 0).
Trials
Trials are the individual training runs. Each trial is associated with a specific runtime instance. The trials page displays a list of all training runs. Each trial includes the following information:
- Trial Number
- Trial Status
- Completion percentage
- Elapsed time
- Estimated time
 Snapshot of Protean AI Platform
Status
The trial status indicates the current state of the training run. The status can be one of the following:
- Running: Training trial is in progress.
- Waiting: Training trial is queued and waiting to run.
- Complete: Training trial has completed successfully.
- Pruned: Training trial was stopped early because it was not improving.
- Fail: Training trial has failed.
This is different from the runtime status, which indicates the current state of the runtime instance. The runtime status can be one of the following:
- Started: Runtime instance is in progress.
- Aborted: Runtime instance was stopped manually.
- Failed: Runtime instance is in the process of being terminated.
- Completed: Runtime instance has completed successfully.
Completion Percentage
The completion percentage indicates the proportion of training steps that have finished out of the total planned for the trial. It is derived from the current step against the total step count and updates as the trial runs, so it reflects live progress rather than a fixed estimate. Tracking it lets you judge how far along a trial is at a glance without inspecting the step monitor.
Elapsed Time
The elapsed time indicates how long the training has been running for the trial. It accumulates from the moment the trial starts and continues until the trial completes or stops, giving you a running measure of consumed time. This is useful for understanding the actual cost of a run and for spotting trials that are taking longer than expected.
Estimated Time
The estimated time indicates the time remaining for the entire training to complete. It is projected from the current rate of progress, so it adjusts as the trial speeds up or slows down across steps. Reading it together with the elapsed time helps you plan around when results will be ready.
Metrics & Visualization
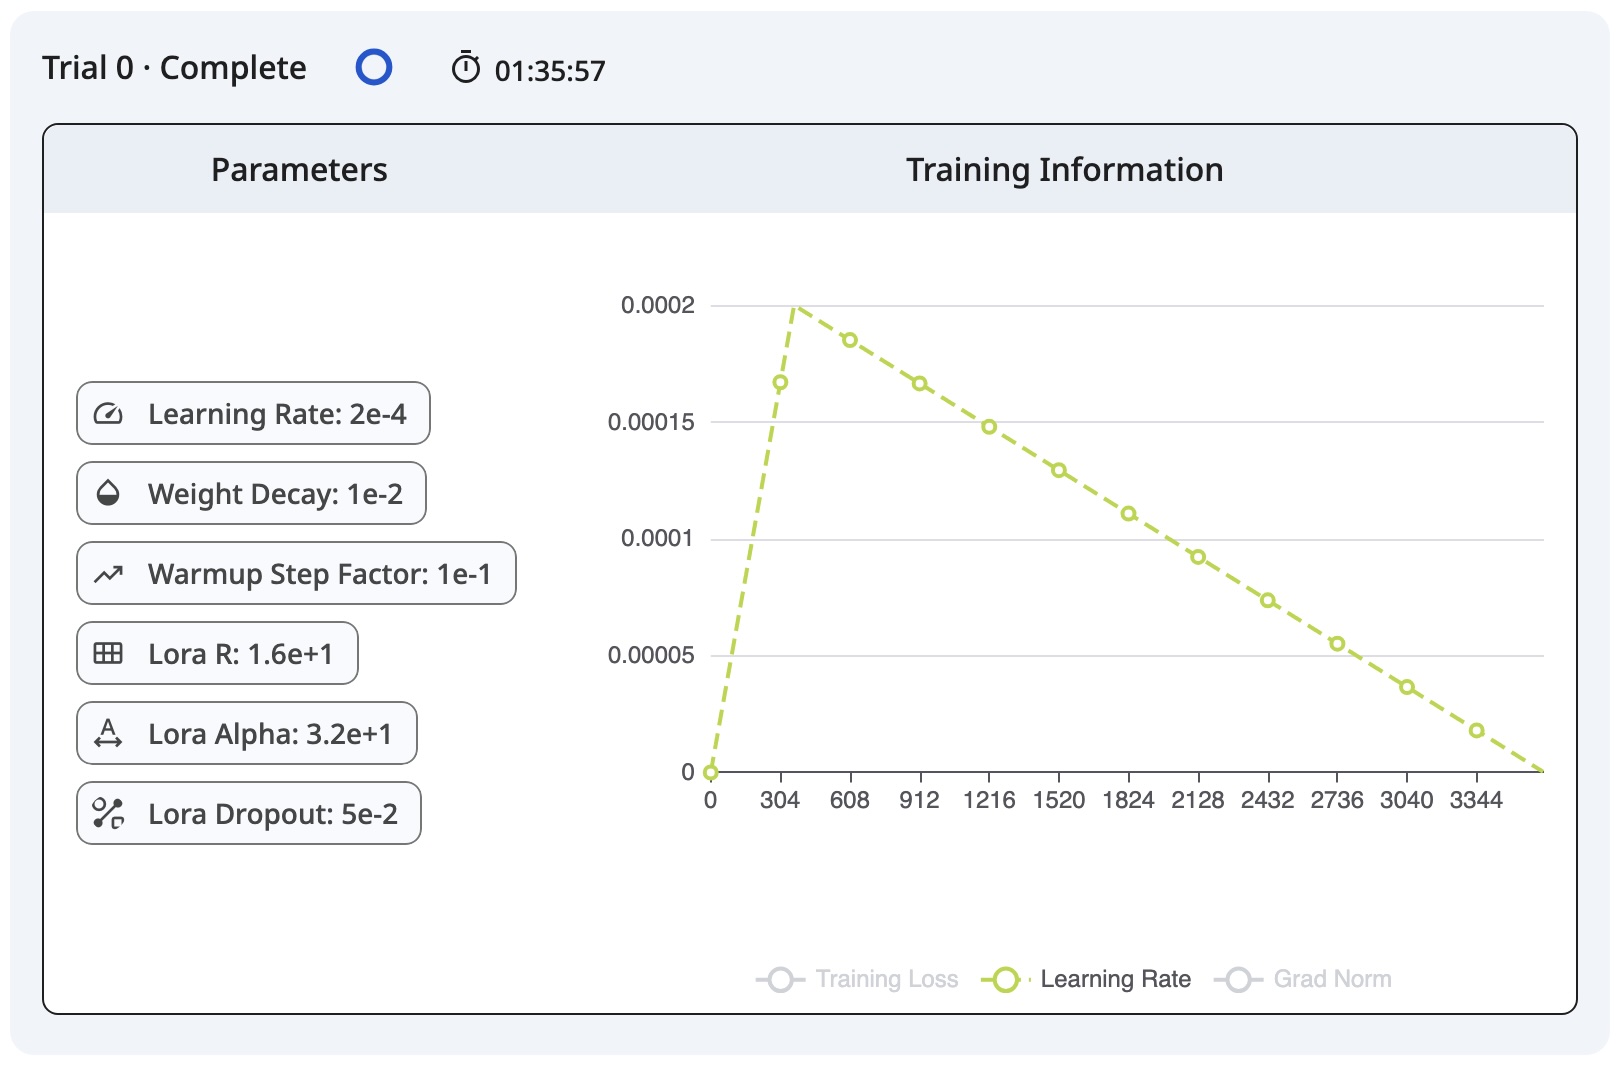
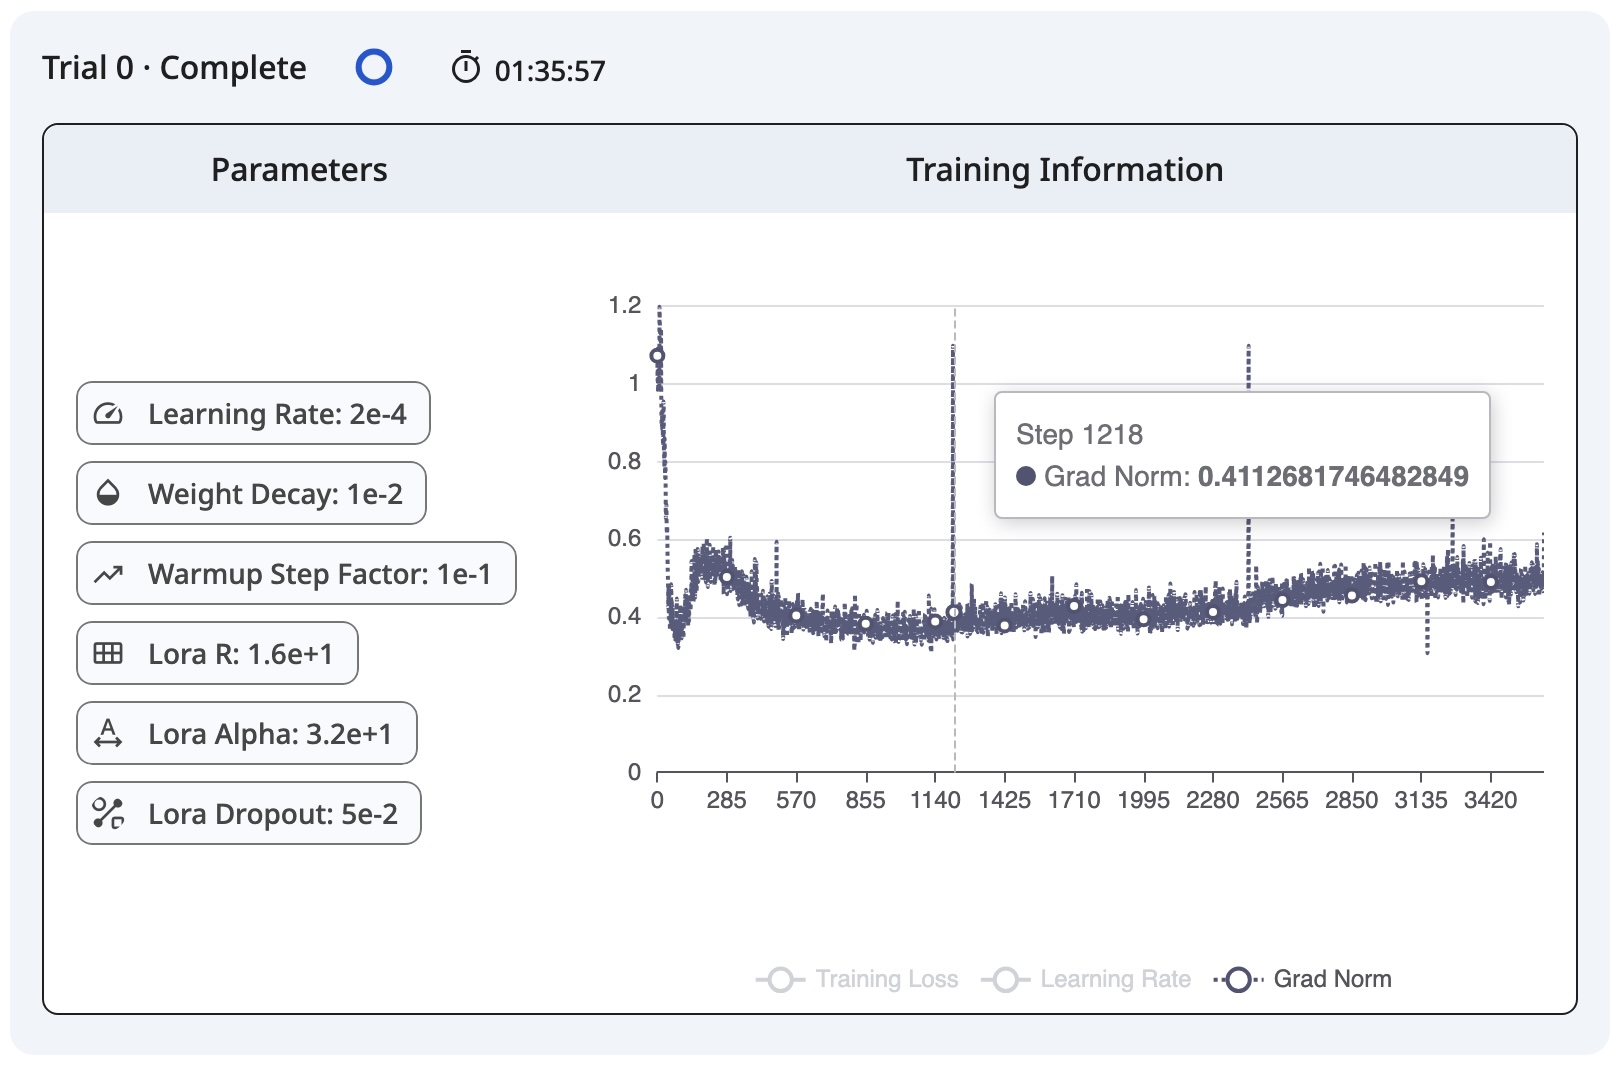
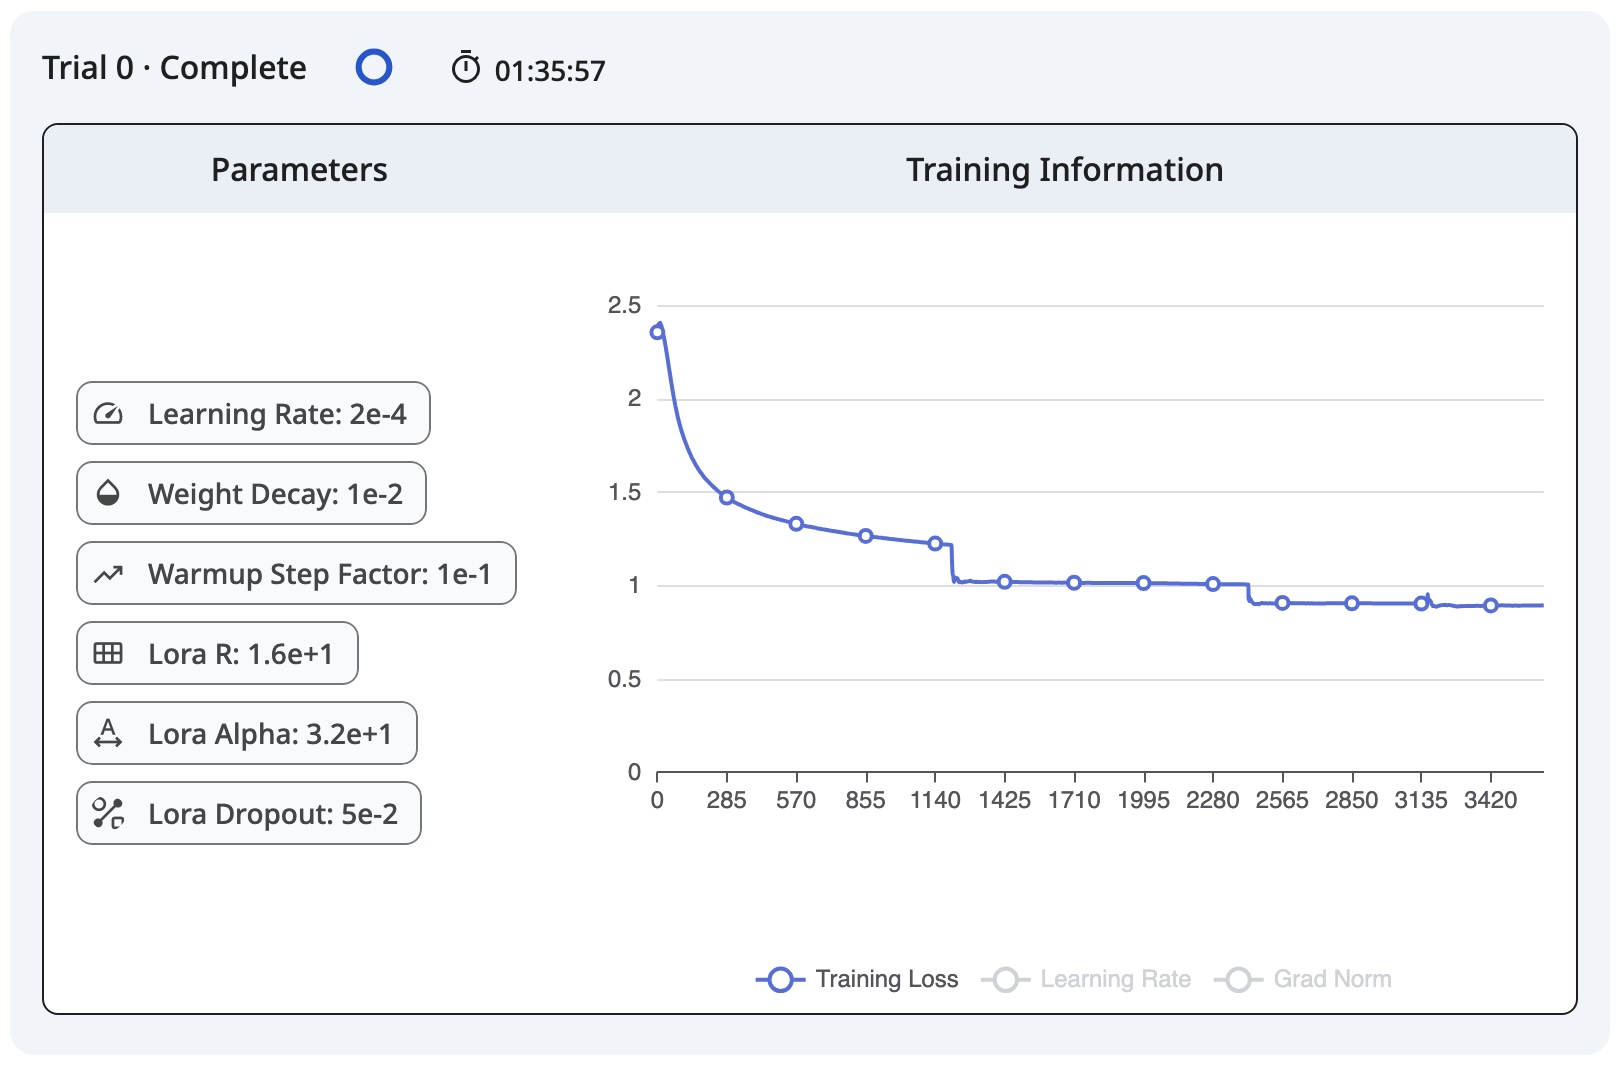
Real-time graphs track the mathematical health of the training process across all epochs. The graph plots the following metrics against the Global Step:
-
Learning Rate (LR): Visualizes the scheduler's behavior (e.g., warm-up phases and weight decay).
 Snapshot of Protean AI Platform
 -
Gradient Norm:: Used to detect exploding or vanishing gradients. A stable norm indicates healthy backpropagation.
 Snapshot of Protean AI Platform
 -
Training Loss:: The average loss across all training examples in the current batch. Look for a downward trend with "noise" that smoothens over time.
 Snapshot of Protean AI Platform