Evaluation
Fine-tuning a model is a critical phase of the development lifecycle; however, the efficacy of the process is determined by whether the weight adjustments align with target performance objectives. This technical reference establishes a standard operating procedure for evaluating model performance across various architectures and dataset configurations to ensure adherence to performance, safety, and domain-specific requirements. By mapping specific architectural choices to dedicated evaluation suites, this framework ensures consistency and reproducibility across all experimental runs.
The following table summarizes the metrics utilized for each purpose, model architecture and their primary functional purpose.
| Purpose | Architecture | Primary Metrics | Functional Focus |
|---|---|---|---|
| Embedding | Bi-Encoder | valLoss, spearman, pearson, kendallTau, mse, mae | Rank Correlation: Measures alignment between predicted cosine similarity and ground-truth scores. |
| Reranking | Cross-Encoder | valLoss, rocAuc, accuracy, f1, averagePrecision | Relevance Ranking: Evaluates the capability to distinguish between relevant and irrelevant query-document pairs. |
| Chat / Conversational | Decoder | valLoss, perplexity, accuracy | Language Modeling: Quantifies text fluency, token prediction accuracy, and distributional uncertainty. |
Metric
Embedding
Evaluation focuses on the relationship between vector space proximity and human-labeled similarity.
- Spearman / Kendall Tau: Non-parametric measures that evaluate the monotonic relationship between variables. They are computed by comparing the predicted cosine similarity ordering against the ground-truth similarity ordering, so they reward a model that ranks pairs correctly even when its absolute scores are off. They are prioritized over Pearson for ranking tasks because they focus on the relative order of pairs rather than linear distance, which is what matters when the embedding is used for retrieval.
- MSE / MAE: Mean Squared Error and Mean Absolute Error quantify the direct deviation between predicted and target similarity scores. MSE squares each error so larger gaps are penalized more heavily, while MAE treats every gap linearly. Tracking them shows how far off the raw predicted scores are in absolute terms, which complements the rank-based metrics that ignore absolute distance.
Reranking
Evaluation treats the task as a binary or scoring classification of pairs.
- ROC-AUC: Indicates the probability that the model will rank a randomly chosen positive instance higher than a randomly chosen negative one. It is derived from the model's scores across the full range of decision thresholds, so it captures ranking quality independently of any single cutoff. A higher value means the reranker reliably separates relevant from irrelevant query-document pairs, which is the core requirement of the task.
- Average Precision: Summarizes the precision-recall curve into a single score that represents the quality of the ranked results. It weights correct results that appear higher in the ranking more heavily, so it rewards a model that surfaces relevant documents near the top. This makes it a useful signal when the goal is returning the best matches first rather than simply classifying pairs correctly.
Chat
Evaluation centers on probability distributions across the vocabulary.
- Perplexity: A measure of how well the model's predicted probability distribution matches the validation sample. It is reported per evaluation step so its trend can be tracked across training, and a lower perplexity indicates the model is more confident and fluent. Because it reflects distributional uncertainty rather than a single correct answer, it is a sensitive signal for whether continued training is still improving generation quality.
- Accuracy: In this context, refers to the frequency of predicting the correct next token during validation, also known as Next-Token Prediction. It is measured by checking how often the highest-probability token matches the actual next token in the validation set. Read alongside perplexity, it helps distinguish genuine improvement from a model that plateaus or begins overfitting to specific formatting patterns.
Text Generation
We are working on implementation of this evaluation metric.
Compare Metrics Within a Single Run
Protean AI provides a comprehensive view of metrics across all training epochs. Evaluation take time to complete, hence it is recommended to not perform the evaluation on every optimization step.
To reduce the evaluation time, it is recommended to run evaluation every 10% of the total number of steps in the epoch. This will give a good insight into the trends and stability of the model.
The x axis represents the evaluation steps and the y axis represents the metric value. A tooltip displays the epoch and step number of a training process when the evaluation is performed.
Users can compare metrics across epochs to identify trends and the impact of hyperparameter adjustments. The following charts illustrate the comparison of metrics across epochs in a single trial.
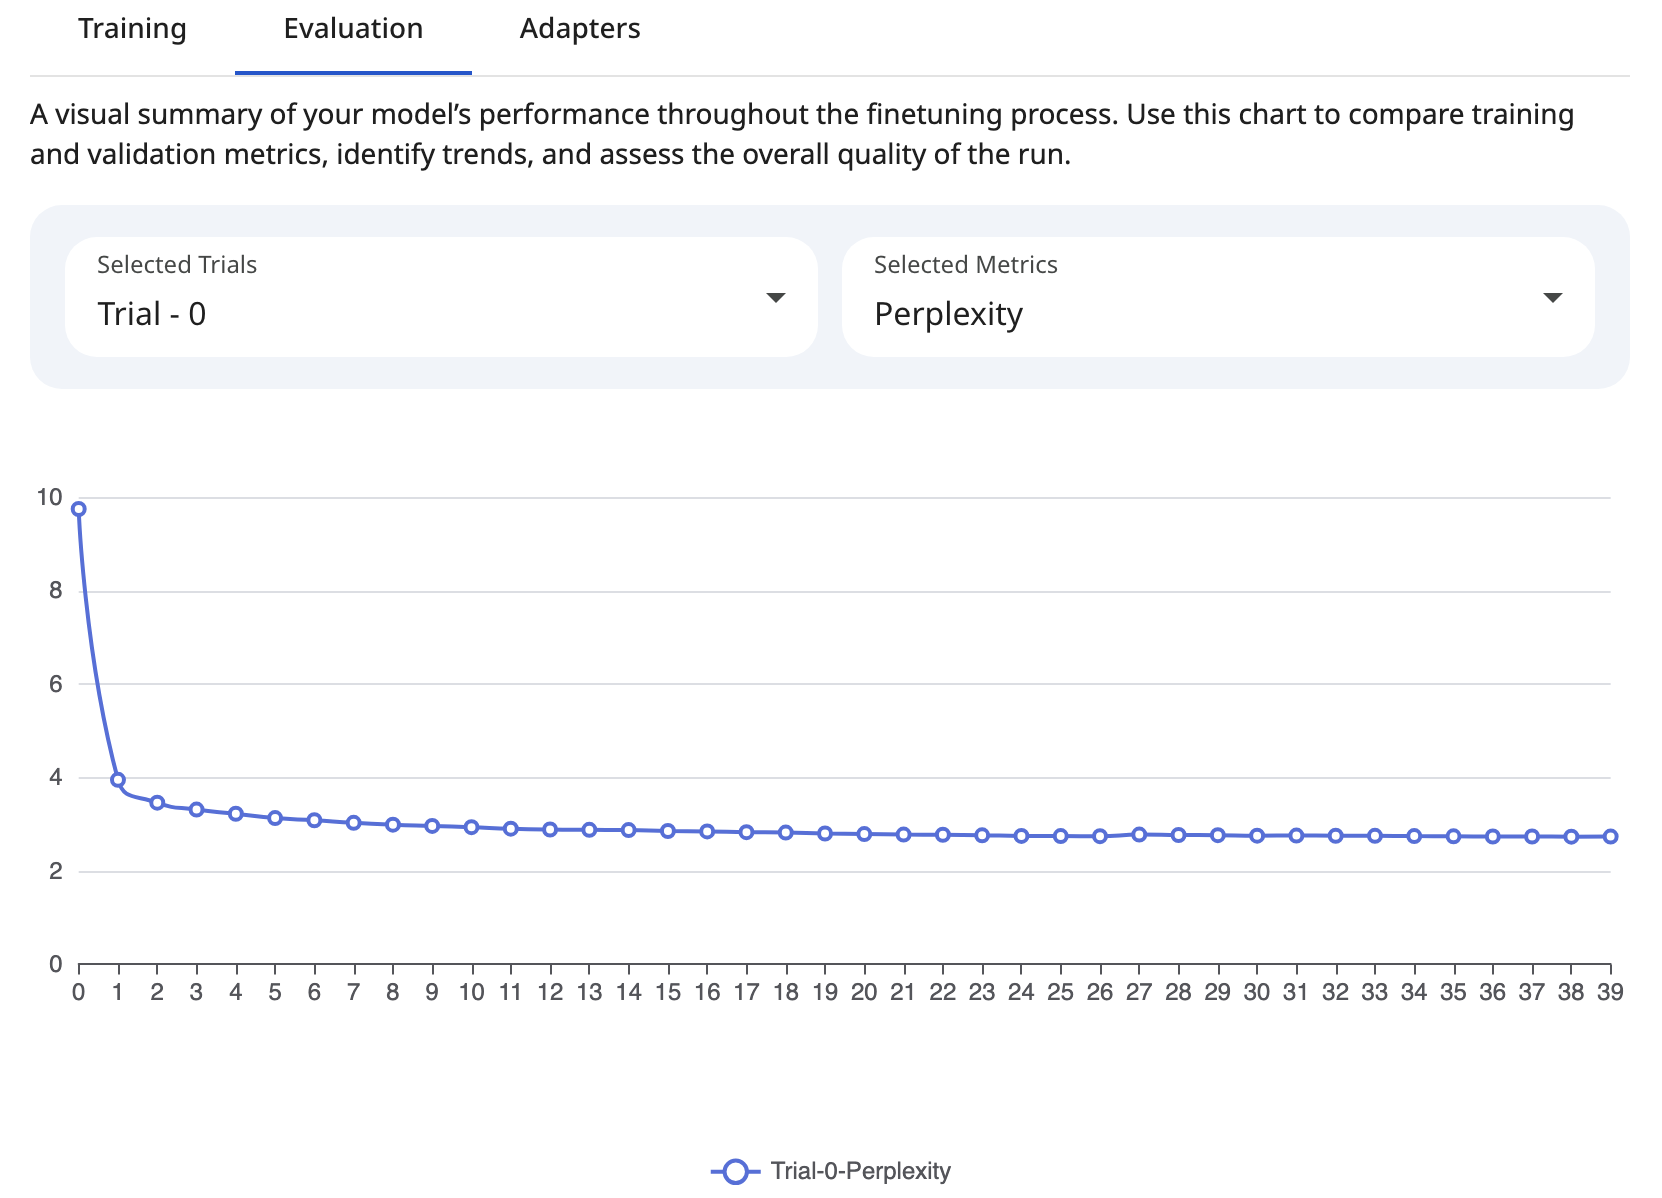 Snapshot of Protean AI Platform
Compare Metrics Across Trials
Evaluating a single fine-tuning run in isolation provides limited insight. To optimize performance, practitioners must compare metrics across multiple trials (experiments) to identify trends, stability, and the impact of hyperparameter adjustments. Protean AI enables a comprehensive comparison of metrics across multiple trials to help identify the best performing model. Select the desired trial and metrics from the dropdown menu. The following chart illustrates the comparison of metrics across multiple trials. Users can choose trials for which to compare metrics.
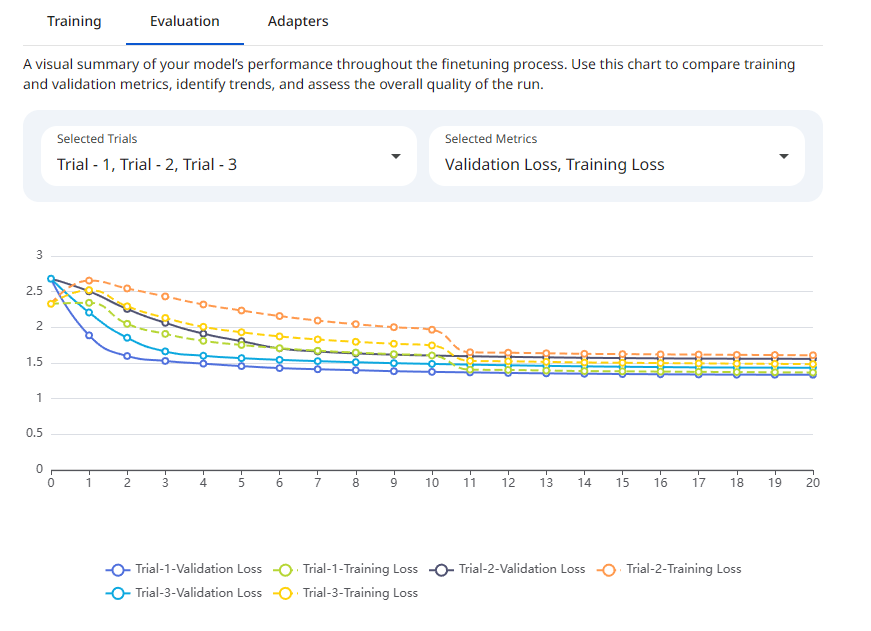 Snapshot of Protean AI Platform
Model Acceptance Criteria (Thresholds)
We are working on this to provide a more detailed guideline.
Workflow
- Loss Analysis: Verify that
valLossis decreasing and converging. Sudden spikes may indicate catastrophic forgetting or learning rate instability. - Correlation Check (Bi-Encoders): Prioritize Spearman over Pearson to ensure that the ranking of retrieved items remains consistent even if absolute similarity scores shift.
- Relevance Check (Cross-Encoders): For Reranking, prioritize ROC AUC and Average Precision over raw Accuracy so that ranking quality, not just classification, is captured.
- Generative Stability: For Decoders, monitor the relationship between
valLossandperplexity. IfvalLossdecreases whileaccuracyplateaus, investigate potential overfitting on specific formatting patterns.